Deploying OTEL Collector as Daemonset
December 02, 2023
The open telemetry collector is one of the most popular CNCF projects that attempts to standardise telemetry data collection, processing, and export. At Pixxel, we use OTEL Collector to discover targets in a k8s cluster, scrape metrics from the configured endpoint and export the metrics to the Grafana Mimir server. This is a mix of both push and pull approaches. The pull part refers to discovering targets and scraping the endpoints. The push part refers to remote-writing the metrics to a Monitoring server.
An alternative way to achieve this setup is to run Prometheus in agent mode which can scrape targets and remotewrite to desired endpoint. However, a significant drawback is fault tolerance. One Prometheus pod per cluster(agent or normal mode) is a single point of failure. If that pod becomes unhealthy, you may lose metrics for the whole cluster. However, these limitations can be overcome by proper resource/limit configuration to signal the priority of the pod to the Kubernetes cluster or by correct retry/buffer configuration that presents you with more ops work. Moreover, you may need to revisit these configurations as and when the workload increases in the cluster. It feels more work than a setup that distributes the scraping workload to many replicas(daemon sets). The OTEL collector was a no-brainer choice since Prometheus doesn’t support a daemon set deployment. Although there are other collectors that support daemonset deployment: like Grafana Agent.
The following section describes configuring the OTEL collector as a daemon set. The fun part is leveraging Kubernetes pod service discovery with a node name filter. Since there weren’t many good tutorials available on this deployment mode, I decided to write one :P
Setup
Let’s use the OTEL Collector helm chart to deploy it as Daemonset. I’ll be using Minikube for the demonstration below. Let’s start a local Kubernetes cluster with two nodes.
minikube start --nodes 2 -p local-k8s-clusterAdd OpenTelemety repo to Helm:
helm repo add open-telemetry https://open-telemetry.github.io/opentelemetry-helm-chartsService Discovery
We want to scrape only those pods running on the same node for each OTEL collector pod. We can achieve that in 2 steps:
- Discover all pods using
kubernetes_sd_config. We will need to provide cluster roles to our daemon set to discover pods. - Filter using
nodeNamespec. ref.
scrape_configs:
  - job_name: otel-daemon-scraping
    scheme: http
    kubernetes_sd_configs:
      - role: pod
        selectors:
          - role: pod
            # only scrape data from pods running on the same node as the collector
            # assuming KUBE_NODE_NAME env will be set in collector pods env
            field: 'spec.nodeName=${env:KUBE_NODE_NAME}'
With the nodeName field selector filter, we can pick only targets on the same node. The node name is read from the env variable(assuming it is set in the env of the pods during provisioning). Prometheus doesn’t support env variables in the config file, which limits its usage as a daemonset.
After the pods have been discovered per node, we need a way to find the port number and path on the pods to scrape metrics. We can leverage pod labels and annotations for this. OTEL Collector provides the pod label and annotations inside the metric label for that target, which we can read and take required action using relabeling(relabel_configs):
relabel_configs:
  # scrape pods annotated with "prometheus.io/scrape: true"
  - source_labels: [__meta_kubernetes_pod_annotation_prometheus_io_scrape]
    regex: true
    action: keep
  # read the port from "prometheus.io/port: <port>" annotation and update scraping address accordingly
  - source_labels:
      [__address__, __meta_kubernetes_pod_annotation_prometheus_io_port]
    action: replace
    target_label: __address__
    regex: ([^:]+)(?::\d+)?;(\d+)
    # escaped $1:$2
    replacement: $$1:$$2
The first item in the relabel_configs array checks for the presence of the annotation prometheus.io/scrape: true on the discovered target. Only those targets that match the regex specified in the keep block are kept. keep and drop actions allow us to filter out targets and metrics based on whether our label values match the provided regex. The second item in the array configures the host and port of the target. The scheme is set to http by default. The path is set to /metrics by default. These configs can also be overridden by relabelling but we will go with the defaults for brevity.
So far, we have established the receiver configuration of the OTEL Collector. To complete the demonstration, end to end, I will run a Prometheus Server where our collector pods will write the metrics. We can set up a Grafana instance to query from this server afterwards.
Metric storage with Prometheus
Here is a Kubernetes manifest to create a Prometheus deployment enabled with remote write, exposed via a K8s Service.
# prometheus.yml
apiVersion: v1
kind: ConfigMap
metadata:
  name: prometheus-server-conf
data:
  prometheus.yml: |-
    global:
      scrape_interval: 5s
      evaluation_interval: 5s
    scrape_configs:
---
apiVersion: apps/v1
kind: Deployment
metadata:
  name: prometheus
  labels:
    app: prometheus-server
spec:
  replicas: 1
  selector:
    matchLabels:
      app: prometheus-server
  template:
    metadata:
      labels:
        app: prometheus-server
    spec:
      containers:
        - name: prometheus
          image: prom/prometheus
          args:
            - '--storage.tsdb.retention.time=12h'
            - '--config.file=/etc/prometheus/prometheus.yml'
            - '--storage.tsdb.path=/prometheus/'
            - '--enable-feature=remote-write-receiver'
          ports:
            - containerPort: 9090
          volumeMounts:
            - name: prometheus-config-volume
              mountPath: /etc/prometheus/
            - name: prometheus-storage-volume
              mountPath: /prometheus/
      volumes:
        - name: prometheus-config-volume
          configMap:
            defaultMode: 420
            name: prometheus-server-conf
        - name: prometheus-storage-volume
          emptyDir: {}
---
apiVersion: v1
kind: Service
metadata:
  name: prometheus
spec:
  selector:
    app: prometheus-server
  ports:
    - protocol: TCP
      port: 9090
      targetPort: 9090
Apply the above helm override to our cluster.
kubectl apply -f prometheus.ymlAfter applying the above file to our cluster we will have a working Prometheus deployment ready to accept remote writes. It is exposed via a kubernetes service which can be accessed via this DNS:
http://prometheus.default.svc.cluster.local:9090
Collector config
Now is the time to push some data to Prometheus. Let’s deploy our OTEL collector with the proper configuration using the Helm override file below.
# otel-override.yaml
mode: 'daemonset'
extraEnvs:
  - name: KUBE_NODE_NAME
    valueFrom:
      fieldRef:
        fieldPath: spec.nodeName

config:
  exporters:
    logging:
      verbosity: detailed
    prometheusremotewrite:
      endpoint: http://prometheus.default.svc.cluster.local:9090/api/v1/write
      external_labels:
        collector: otel-collector

  receivers:
    prometheus:
      config:
        scrape_configs:
          - job_name: metrics-exporter
            scheme: http
            kubernetes_sd_configs:
              - role: pod
                selectors:
                  - role: pod
                    # # only scrape data from pods running on the same node as prometheus
                    field: 'spec.nodeName=${env:KUBE_NODE_NAME}'
            relabel_configs:
              # scrape pods annotated with "prometheus.io/scrape: true"
              - source_labels:
                  [__meta_kubernetes_pod_annotation_prometheus_io_scrape]
                regex: true
                action: keep
              # read the port from "prometheus.io/port: <port>" annotation and update scraping address accordingly
              - source_labels:
                  [
                    __address__,
                    __meta_kubernetes_pod_annotation_prometheus_io_port
                  ]
                action: replace
                target_label: __address__
                regex: ([^:]+)(?::\d+)?;(\d+)
                # escaped $1:$2
                replacement: $$1:$$2

  service:
    pipelines:
      metrics:
        receivers: [prometheus]
        exporters: [prometheusremotewrite]

clusterRole:
  create: true
  rules:
    - apiGroups: ['']
      resources:
        - pods
      verbs: ['get', 'list', 'watch']

  clusterRoleBinding:
    name: 'otel-discoverer'

ports:
  otlp:
    enabled: false
  otlp-http:
    enabled: false
  jaeger-compact:
    enabled: false
  jaeger-thrift:
    enabled: false
  jaeger-grpc:
    enabled: false
  zipkin:
    enabled: false
  metrics:
    enabled: false
This can be applied to cluster: helm install otel-collector open-telemetry/opentelemetry-collector -f otel-override.yaml
Let’s go through some important aspects of this Helm override:
-
We set the deployment to daemon set using
modeand added an extra env var to capture the node name on each daemon pod of OTEL Collector. -
The metrics pipeline is built using the
prometheusreceiver andprometheusremotewriteexporter defined in their respective sections. If you are unfamiliar with receivers and exporters, here is a reference. -
The receiver has rules for pod discovery using pod annotations. It picks only those pods that are running on the same node using the nodeName field selector. The nodeName is specified in a templated way,
spec.nodeName=${env:KUBE_NODE_NAME}, which will render to node name during runtime. -
The exporter writes to the Prometheus server at its remote write endpoint. It also places a label
collector: otel-collectorin all the series. Such “global” labels can be crucial when running multiple Kubernetes clusters in the same/different cloud accounts(AWS Account/GCP project). -
The required cluster role and binding are specified to discover pods.
-
We also don’t open the OTEL Container Ports that are not needed in the scope of this article.
Node Exporter workload
Let’s run some actual workload and scrape metrics from it. Node Exporter is an utility that exposes machine metrics. For our demonstration, we will run this inside Kubernetes cluster as deamonset. This will ensure there is one pod per minikube node. These pods can be scraped with our OTEL Collector pods.
We will install Node Exporter using the helm chart with all defailt with few additions. The pod annotations will be added for discovering these pods. Since NodeExporter by default exposes the metrics in http scheme and /metrics path, we won’t need to specify it explicitly as our collectors already know that.
Let’s first add the repo:
helm repo add prometheus-community https://prometheus-community.github.io/helm-chartsFor scraping the node exporter pod, we require proper pod annotation that can be specified using the helm override file.
# node-exporter-override.yml
podAnnotations:
  prometheus.io/scrape: "true"
  prometheus.io/port: "9100"
Install NodeExporter using helm with above mentioned override file:
helm install node-exporter prometheus-community/prometheus-node-exporter -f node-exporter-override.ymlWith all components(Node Exporter daemon, OTEL Collector daemon and prometheus pod) up and running, this is how the cluster should look like:
➜  kubectl get pods
NAME                                                 READY   STATUS    RESTARTS   AGE
node-exporter-prometheus-node-exporter-h2vxr         1/1     Running   0          7m
node-exporter-prometheus-node-exporter-kcds4         1/1     Running   0          7m
otel-collector-opentelemetry-collector-agent-9rxm7   1/1     Running   0          5m1s
otel-collector-opentelemetry-collector-agent-mbq6x   1/1     Running   0          5m1s
prometheus-5b54c7c696-4kzjj                          1/1     Running   0          6m4h
Querying data
If everything goes right, you should see the data from node_exporter daemons in Prometheus. The simplest way to query is to pop up the prometheus UI on your browser and query for some data.
You can access the Prometheus UI on your browser by port-forwarding the Prometheus Kubernetes service (make sure your port 9090 on your local machine is free to use)
kubectl port-forward svc/prometheus 9090:9090Navigate to http://localhost:9090 and execute the query shown in the image below. Verify if you are getting a one-time series row per node_exporter.
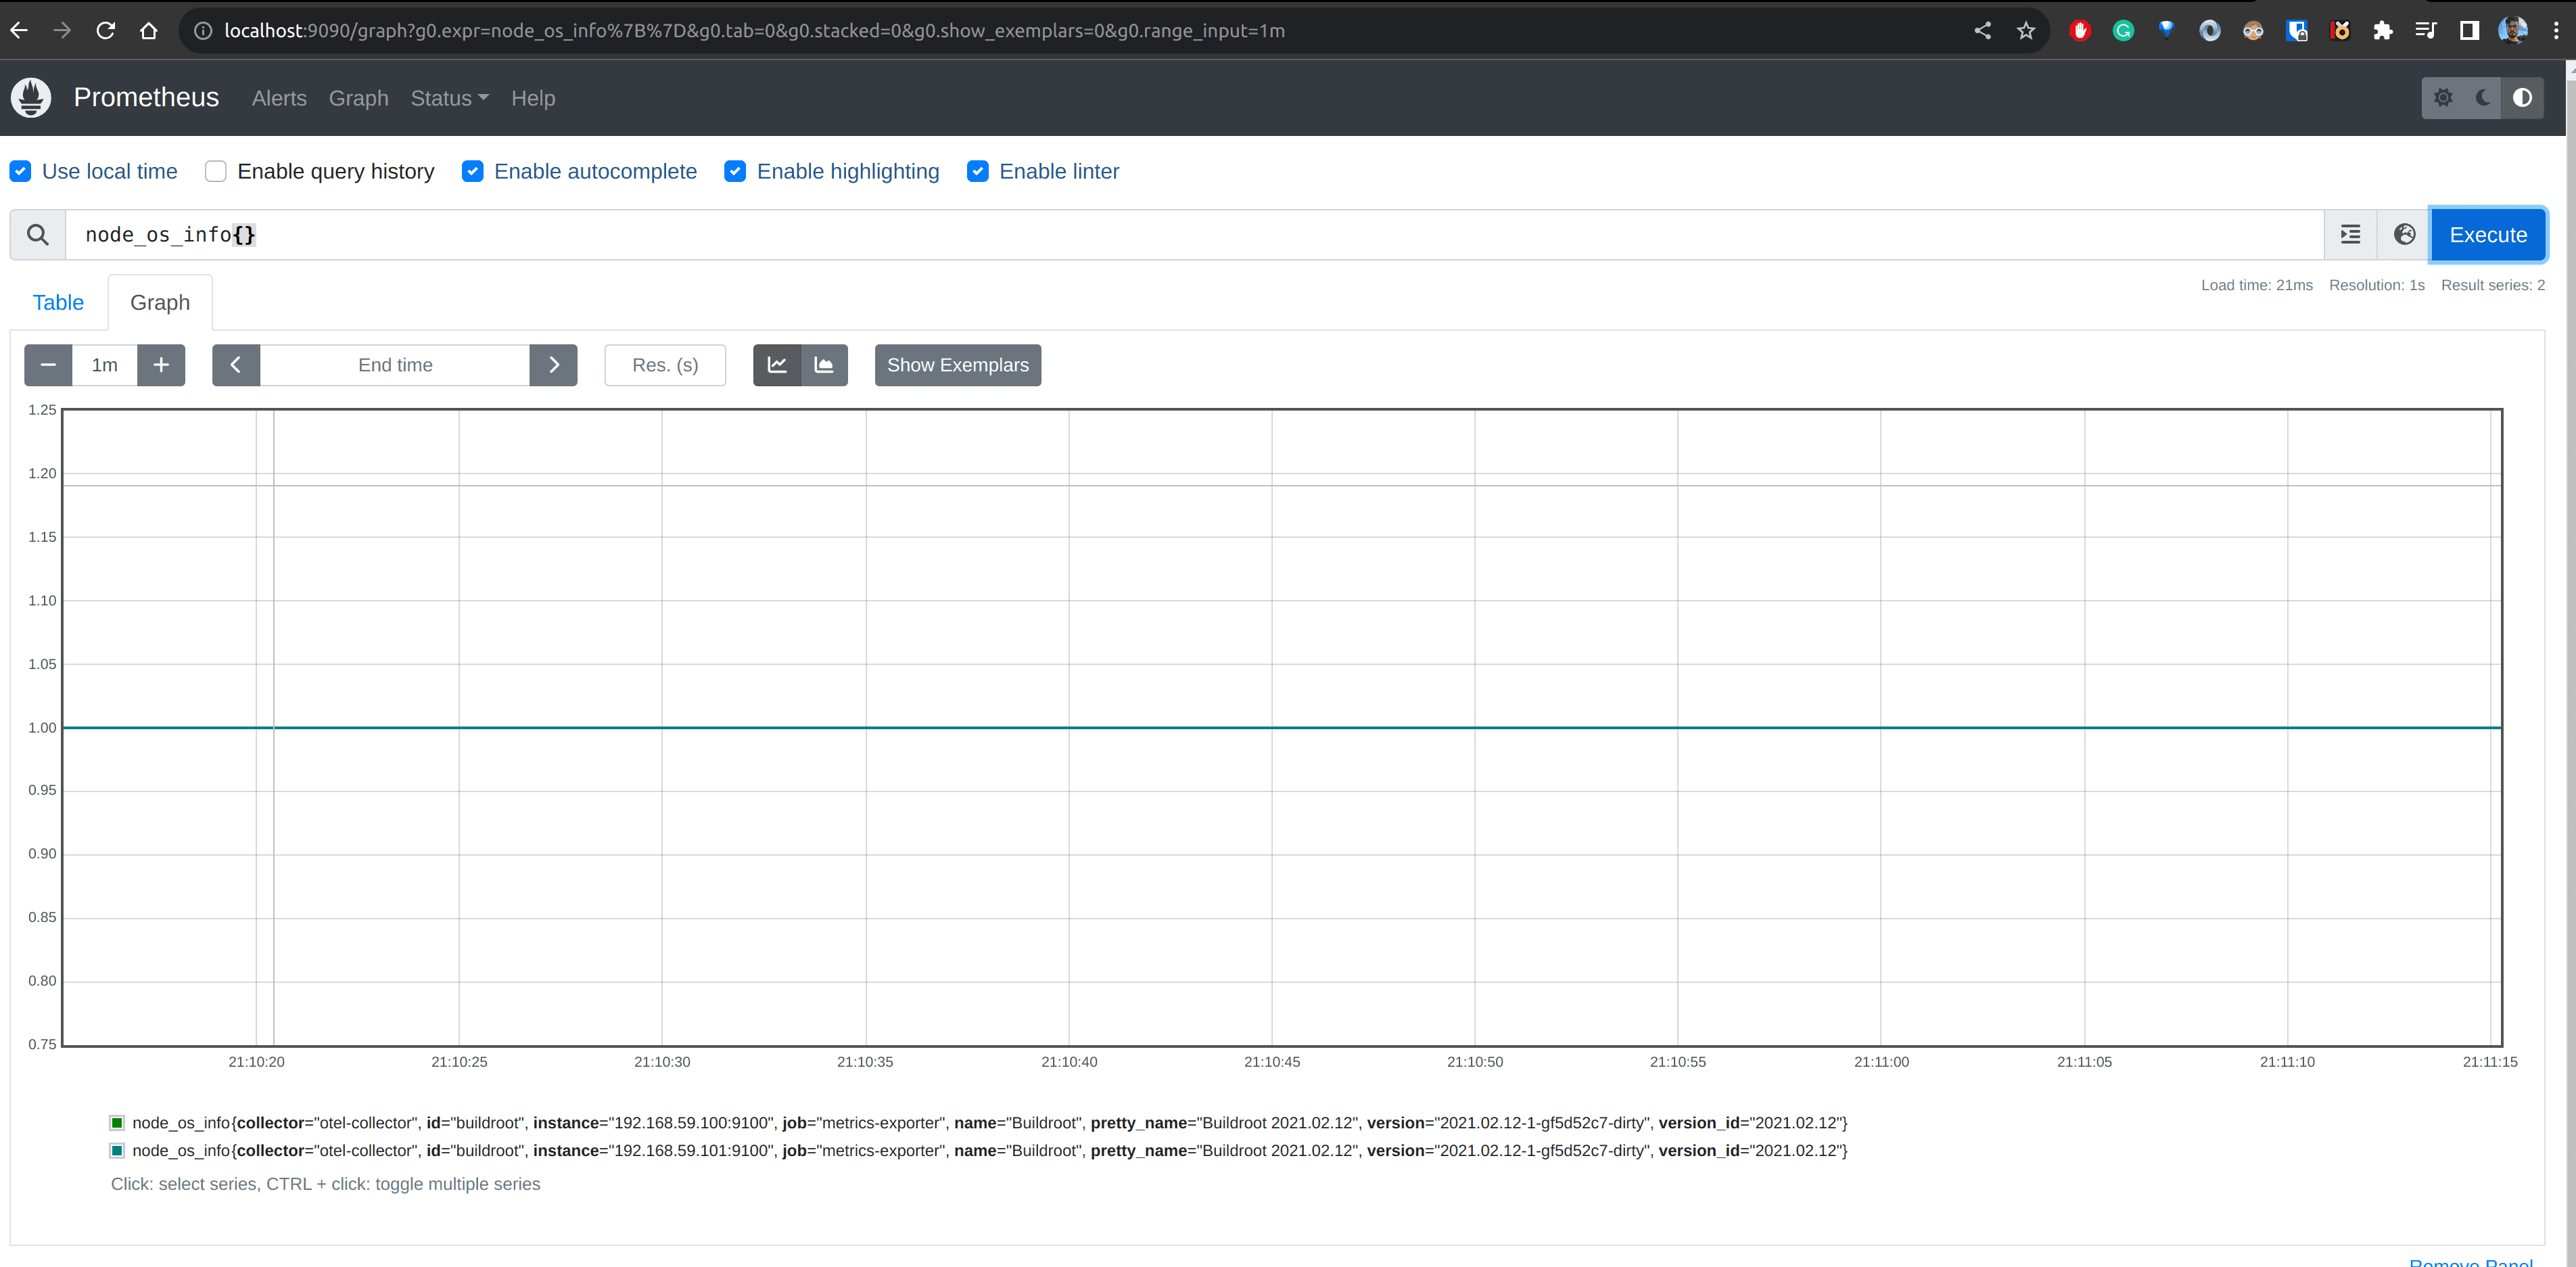
We can also spin up a Grafana instance for better visualisation: Port-forward Prometheus service locally and add the localhost:port as Data Source(also called Connections) in this Grafana instance.
Debugging
If something doesn’t work as expected, you can use debug logs to see the errors.
- OTEL collector debug log: Modify the “service” section to add additional debug config.
service:
  telemetry:
    logs:
      level: "debug"
  pipelines:
    metrics:
      receivers: [prometheus]
exporters: [prometheusremotewrite]- Prometheus debug logs can be enabled via the flag
"--log.level=debug"in thespec.containers.arglist
To recap, we looked into how to deploy OTEL collectors as daemons on a Kubernetes cluster and discover pods local to the collector’s node. We also looked into how to scrape metrics from the discovered pods and export these metrics to a remote server. We ran node exporter pods and scraped metrics from them. We also visualised the metrics in Prometheus UI. In the end, we looked into how to debug in case things don’t work as expected. That’s all I had to document for OTEL Collector usage. Stay tuned for more such blogs!